Most of my academic research revolves around making observations of key high latitude processes. The sections below give an overview of this work.
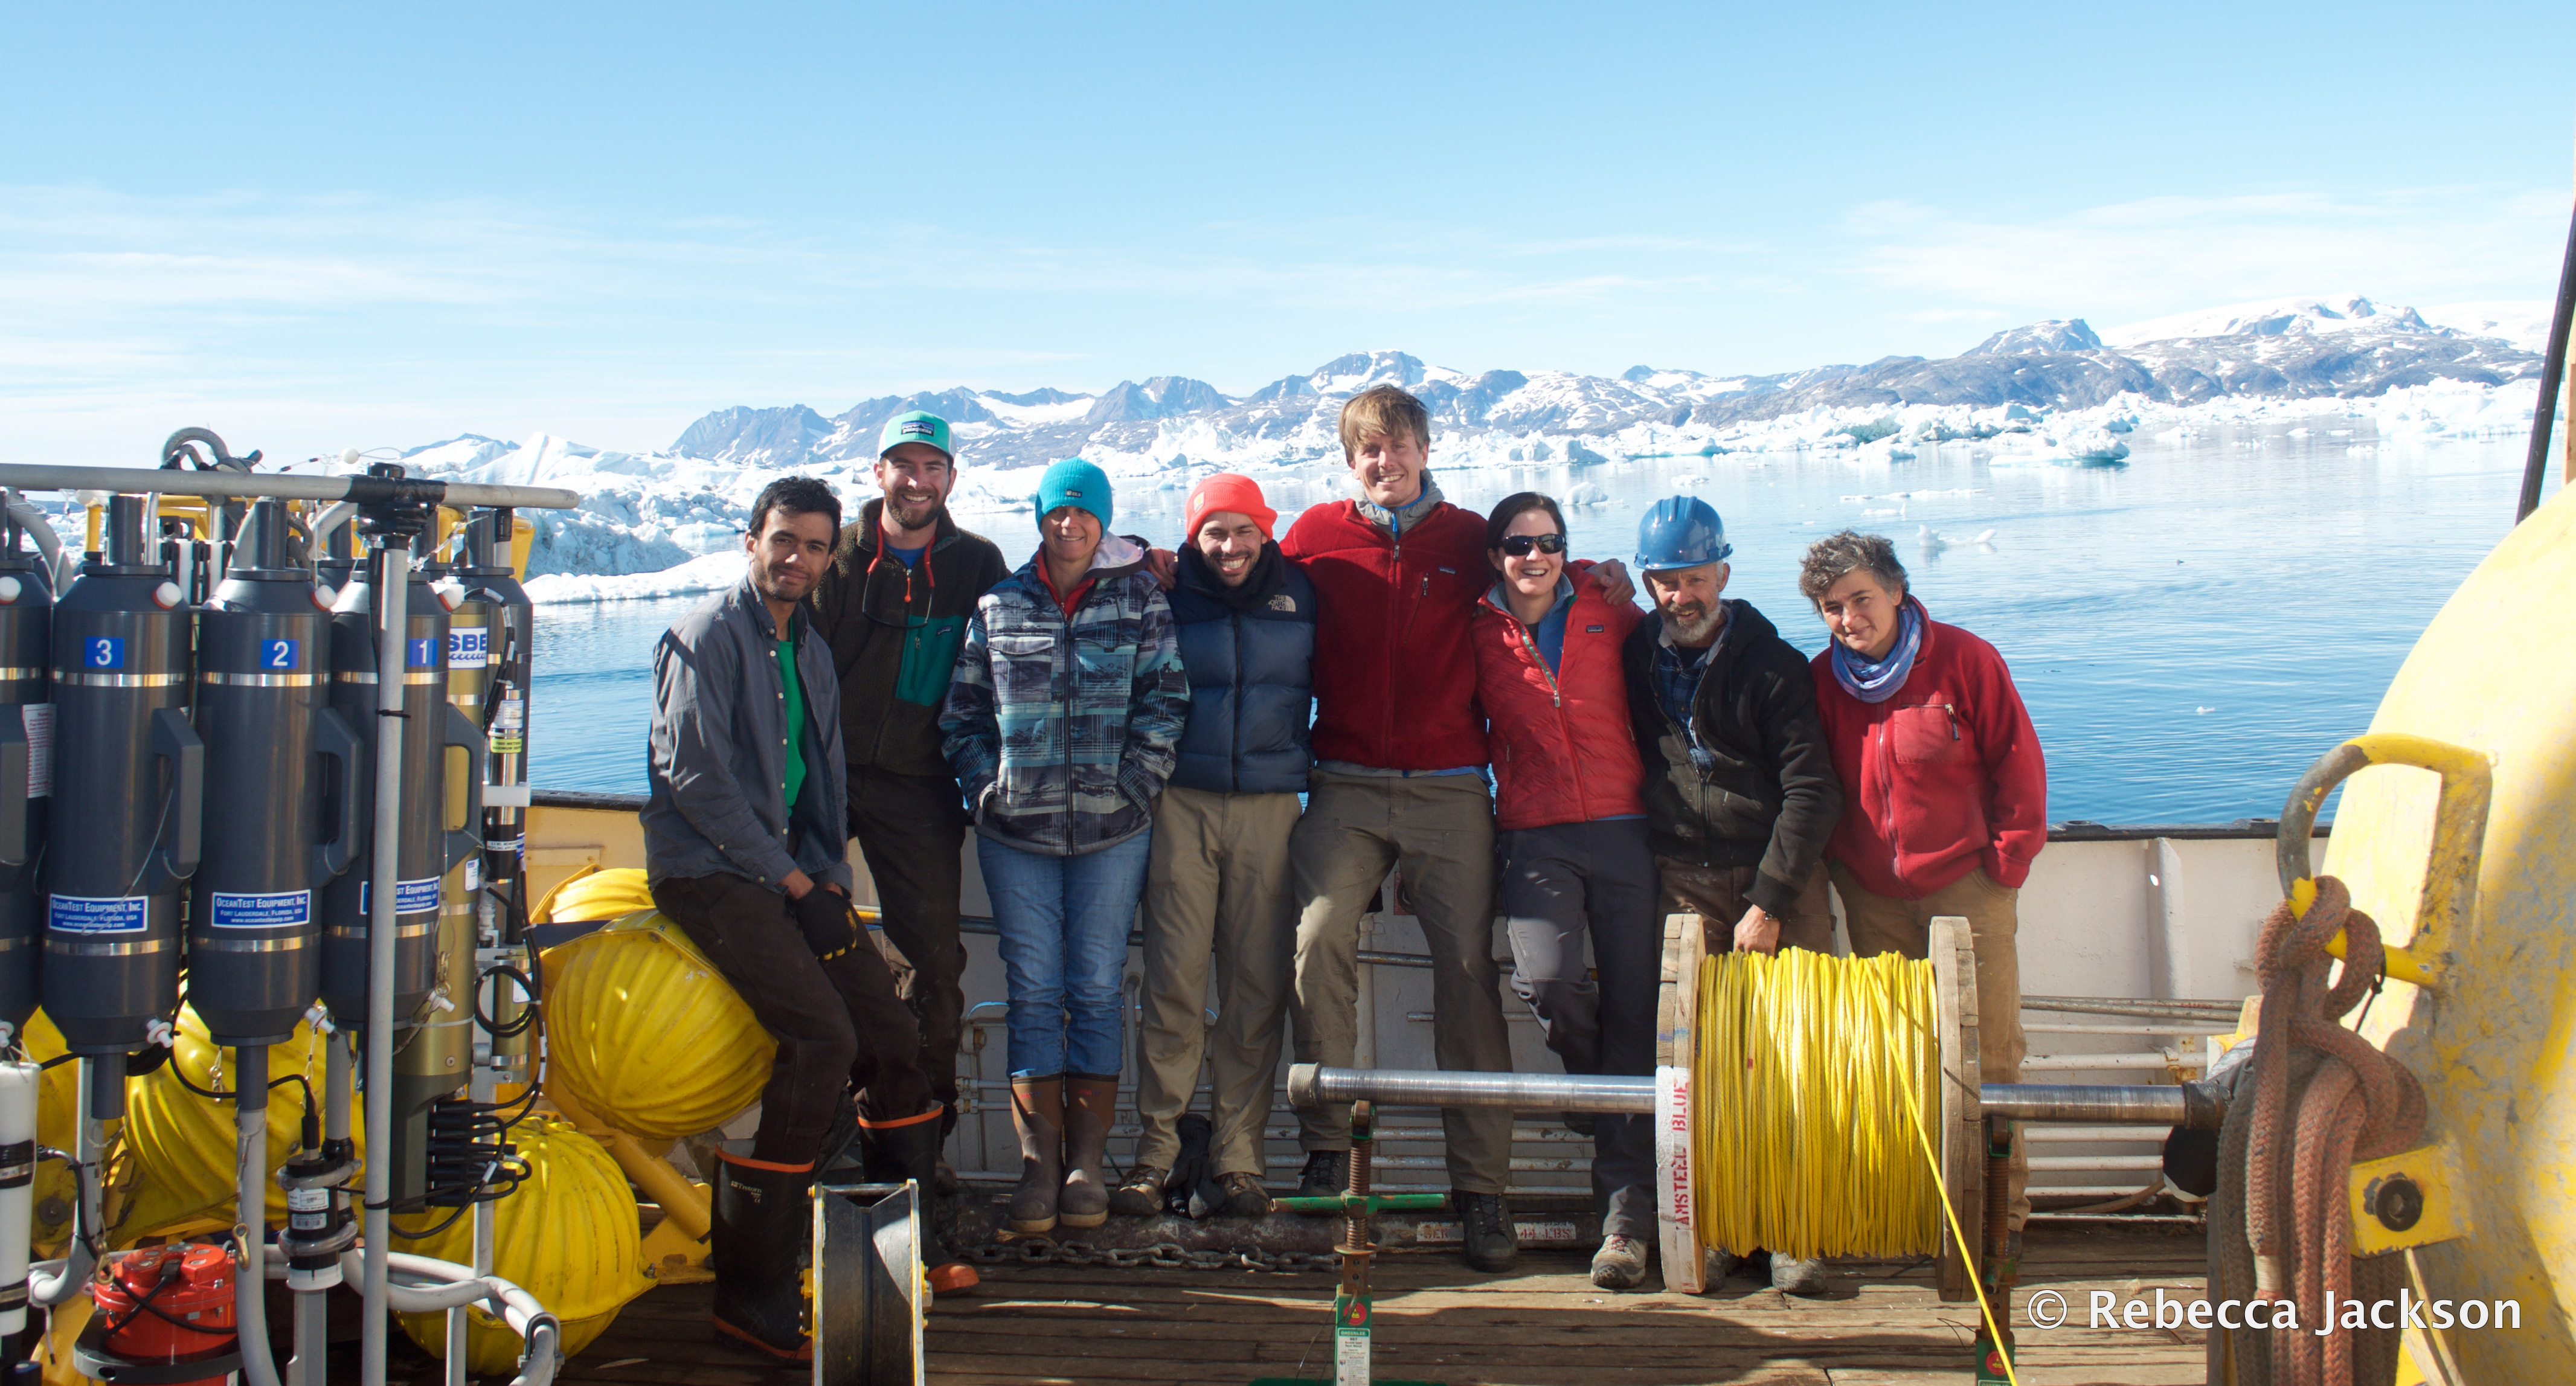
For a sense of this of how this happens, check out some reflections on life at sea from our team in Sermilik Fjord in 2015:
The Dynamic Arctic
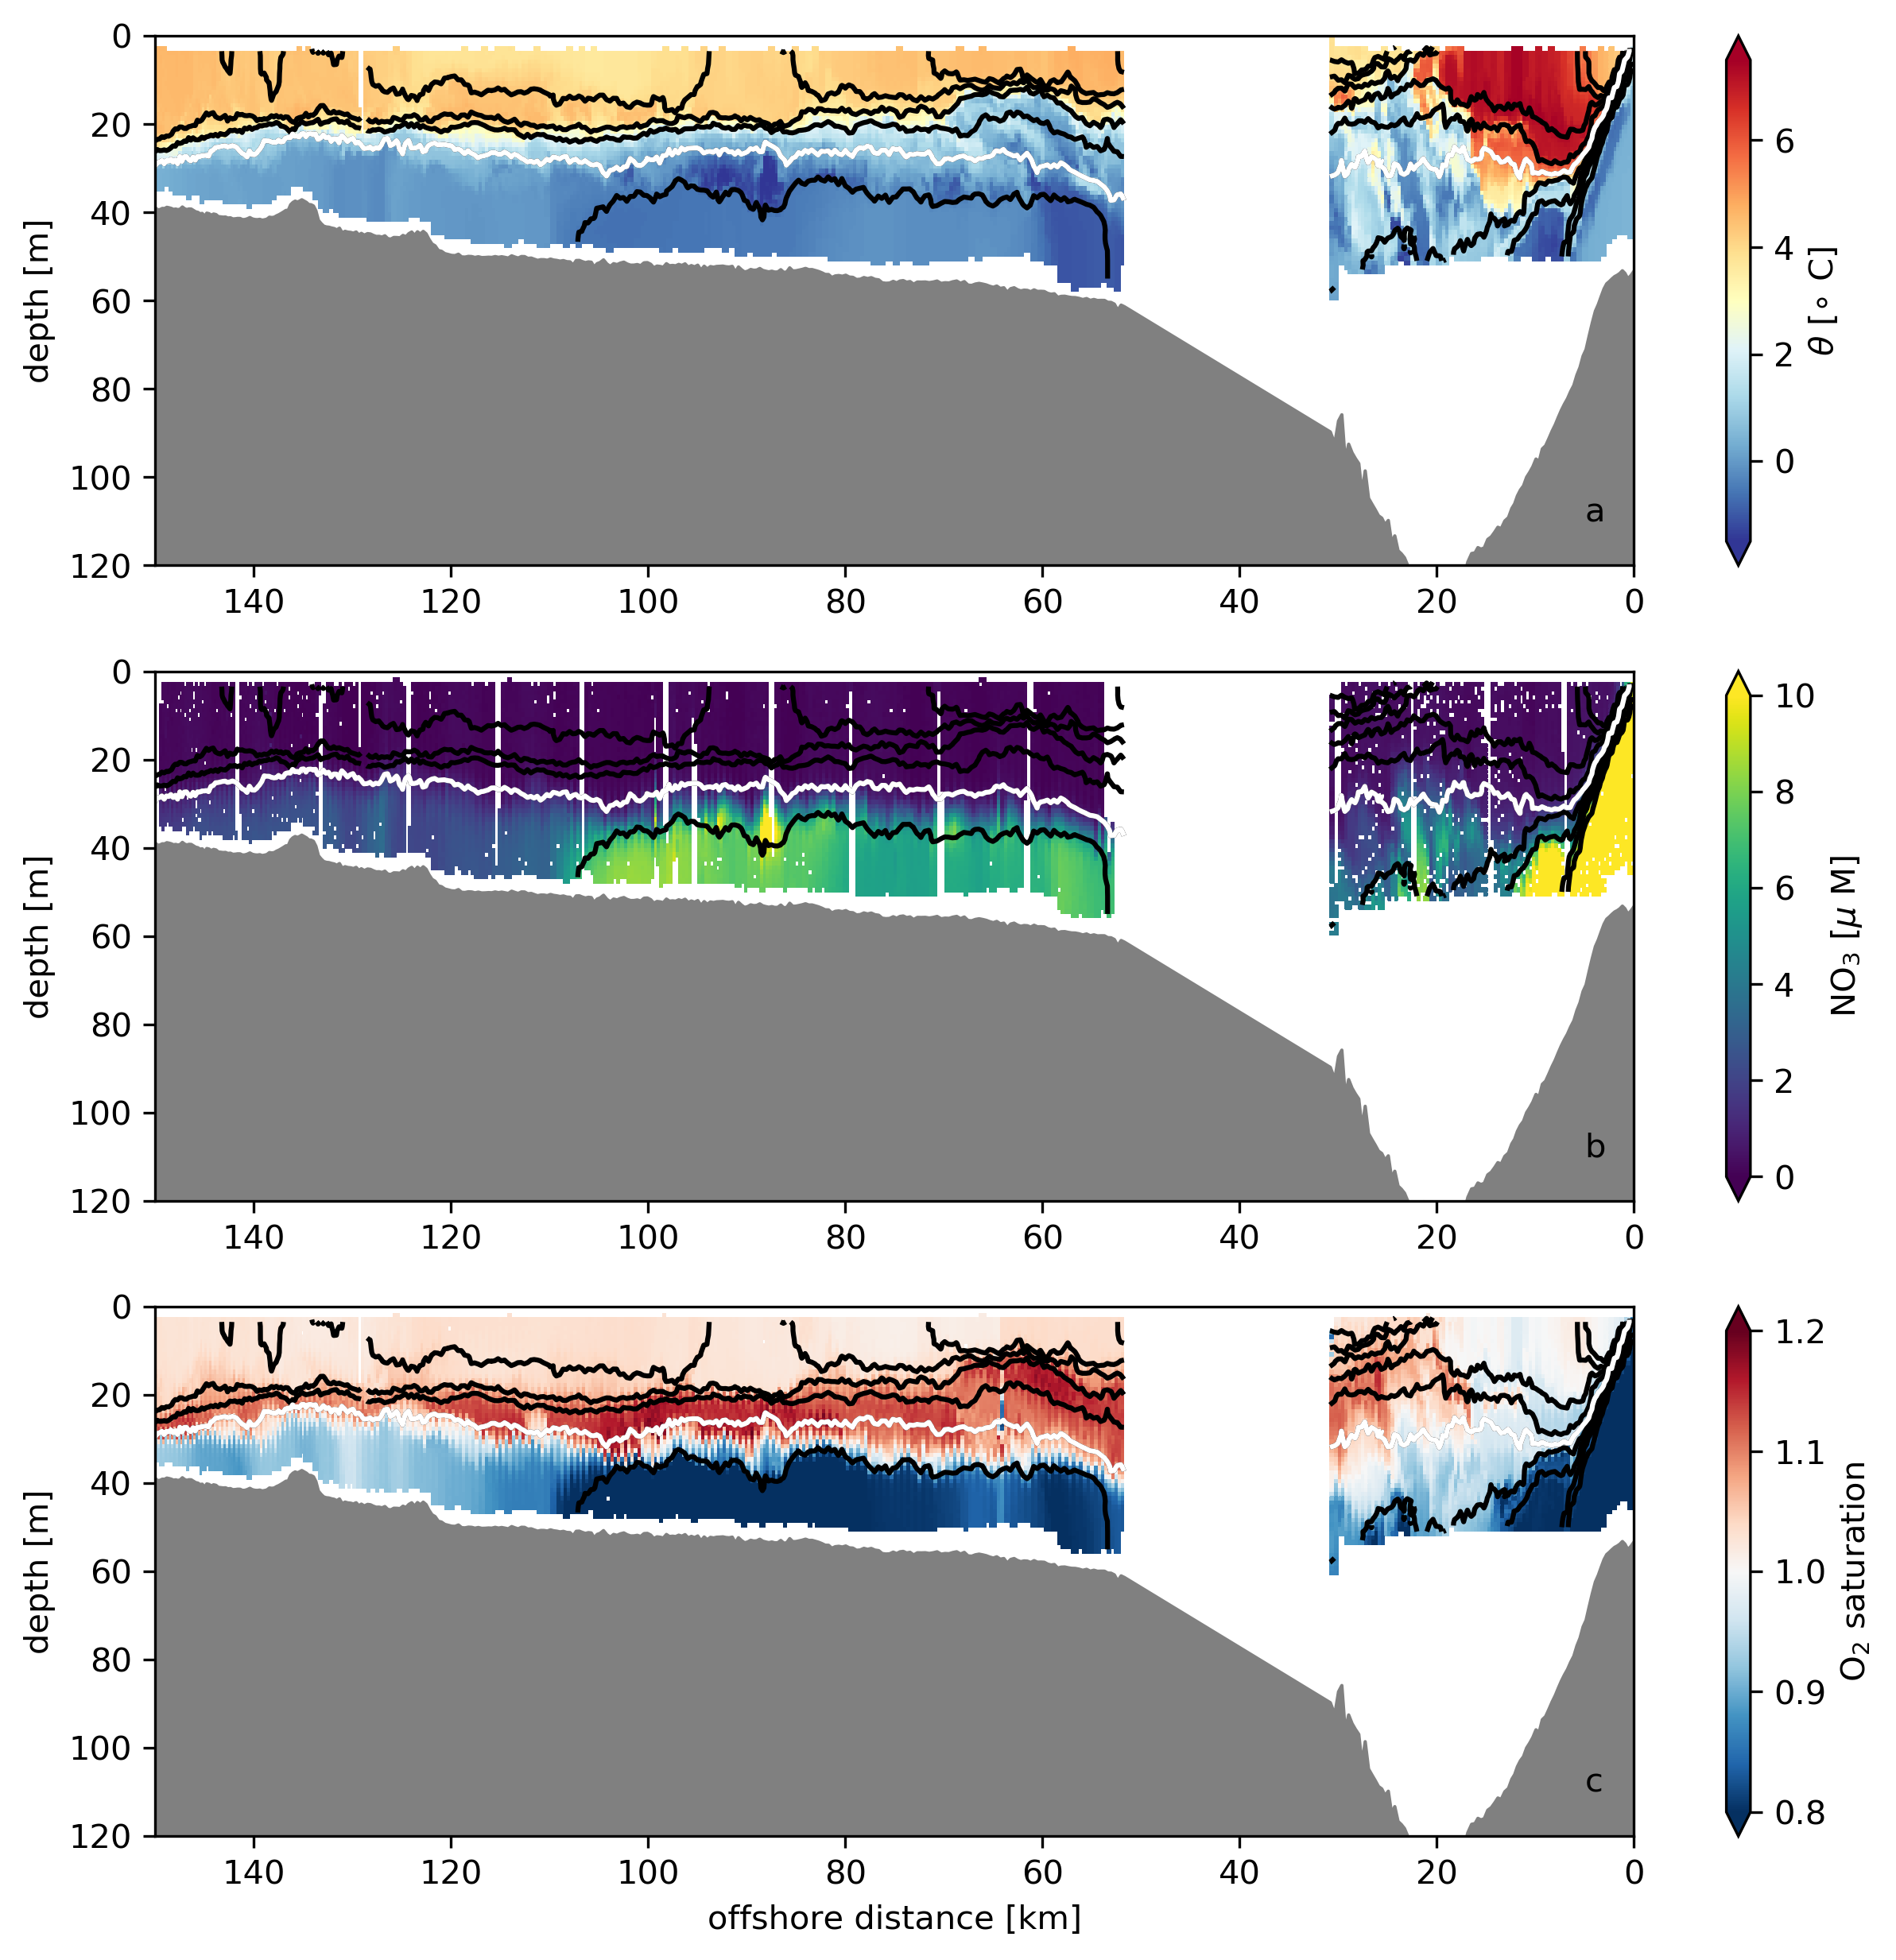
We instrumented a unique biogeochemical towed platform with velocity and turbulence sensors to look in fine detail at physical controls on nutrient distributions in the Chukchi Sea. During the cruise we observed an upwelling event that had dramatic impacts on the nutrient inventories on the shelf. The upwelled dense (nutrient-rich) water formed a gravity current with lots of interesting dynamics properties. See more in our paper Nutrient‐rich gravity current formed by upwelling in Barrow Canyon: High resolution observations
Glacial Meltwater and Ecosystems
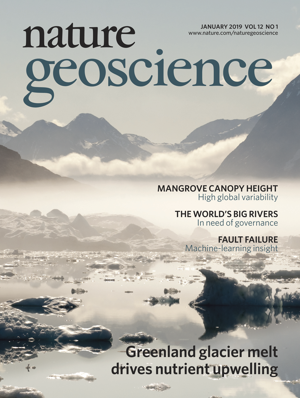
Our exciting new work out lead by Mattias Cape showing the importance of glacial buoyancy input to ecosystems. The upshot: melting ice creates an ocean elevator that carries nutrients from the deep ocean up to the surface where it can be used by phytoplankton. This work shows that this mechanism is really important around Greenland.
Measuring Greenland’s Meltwater
Listen to a radio story about this work from Ari Daniel:
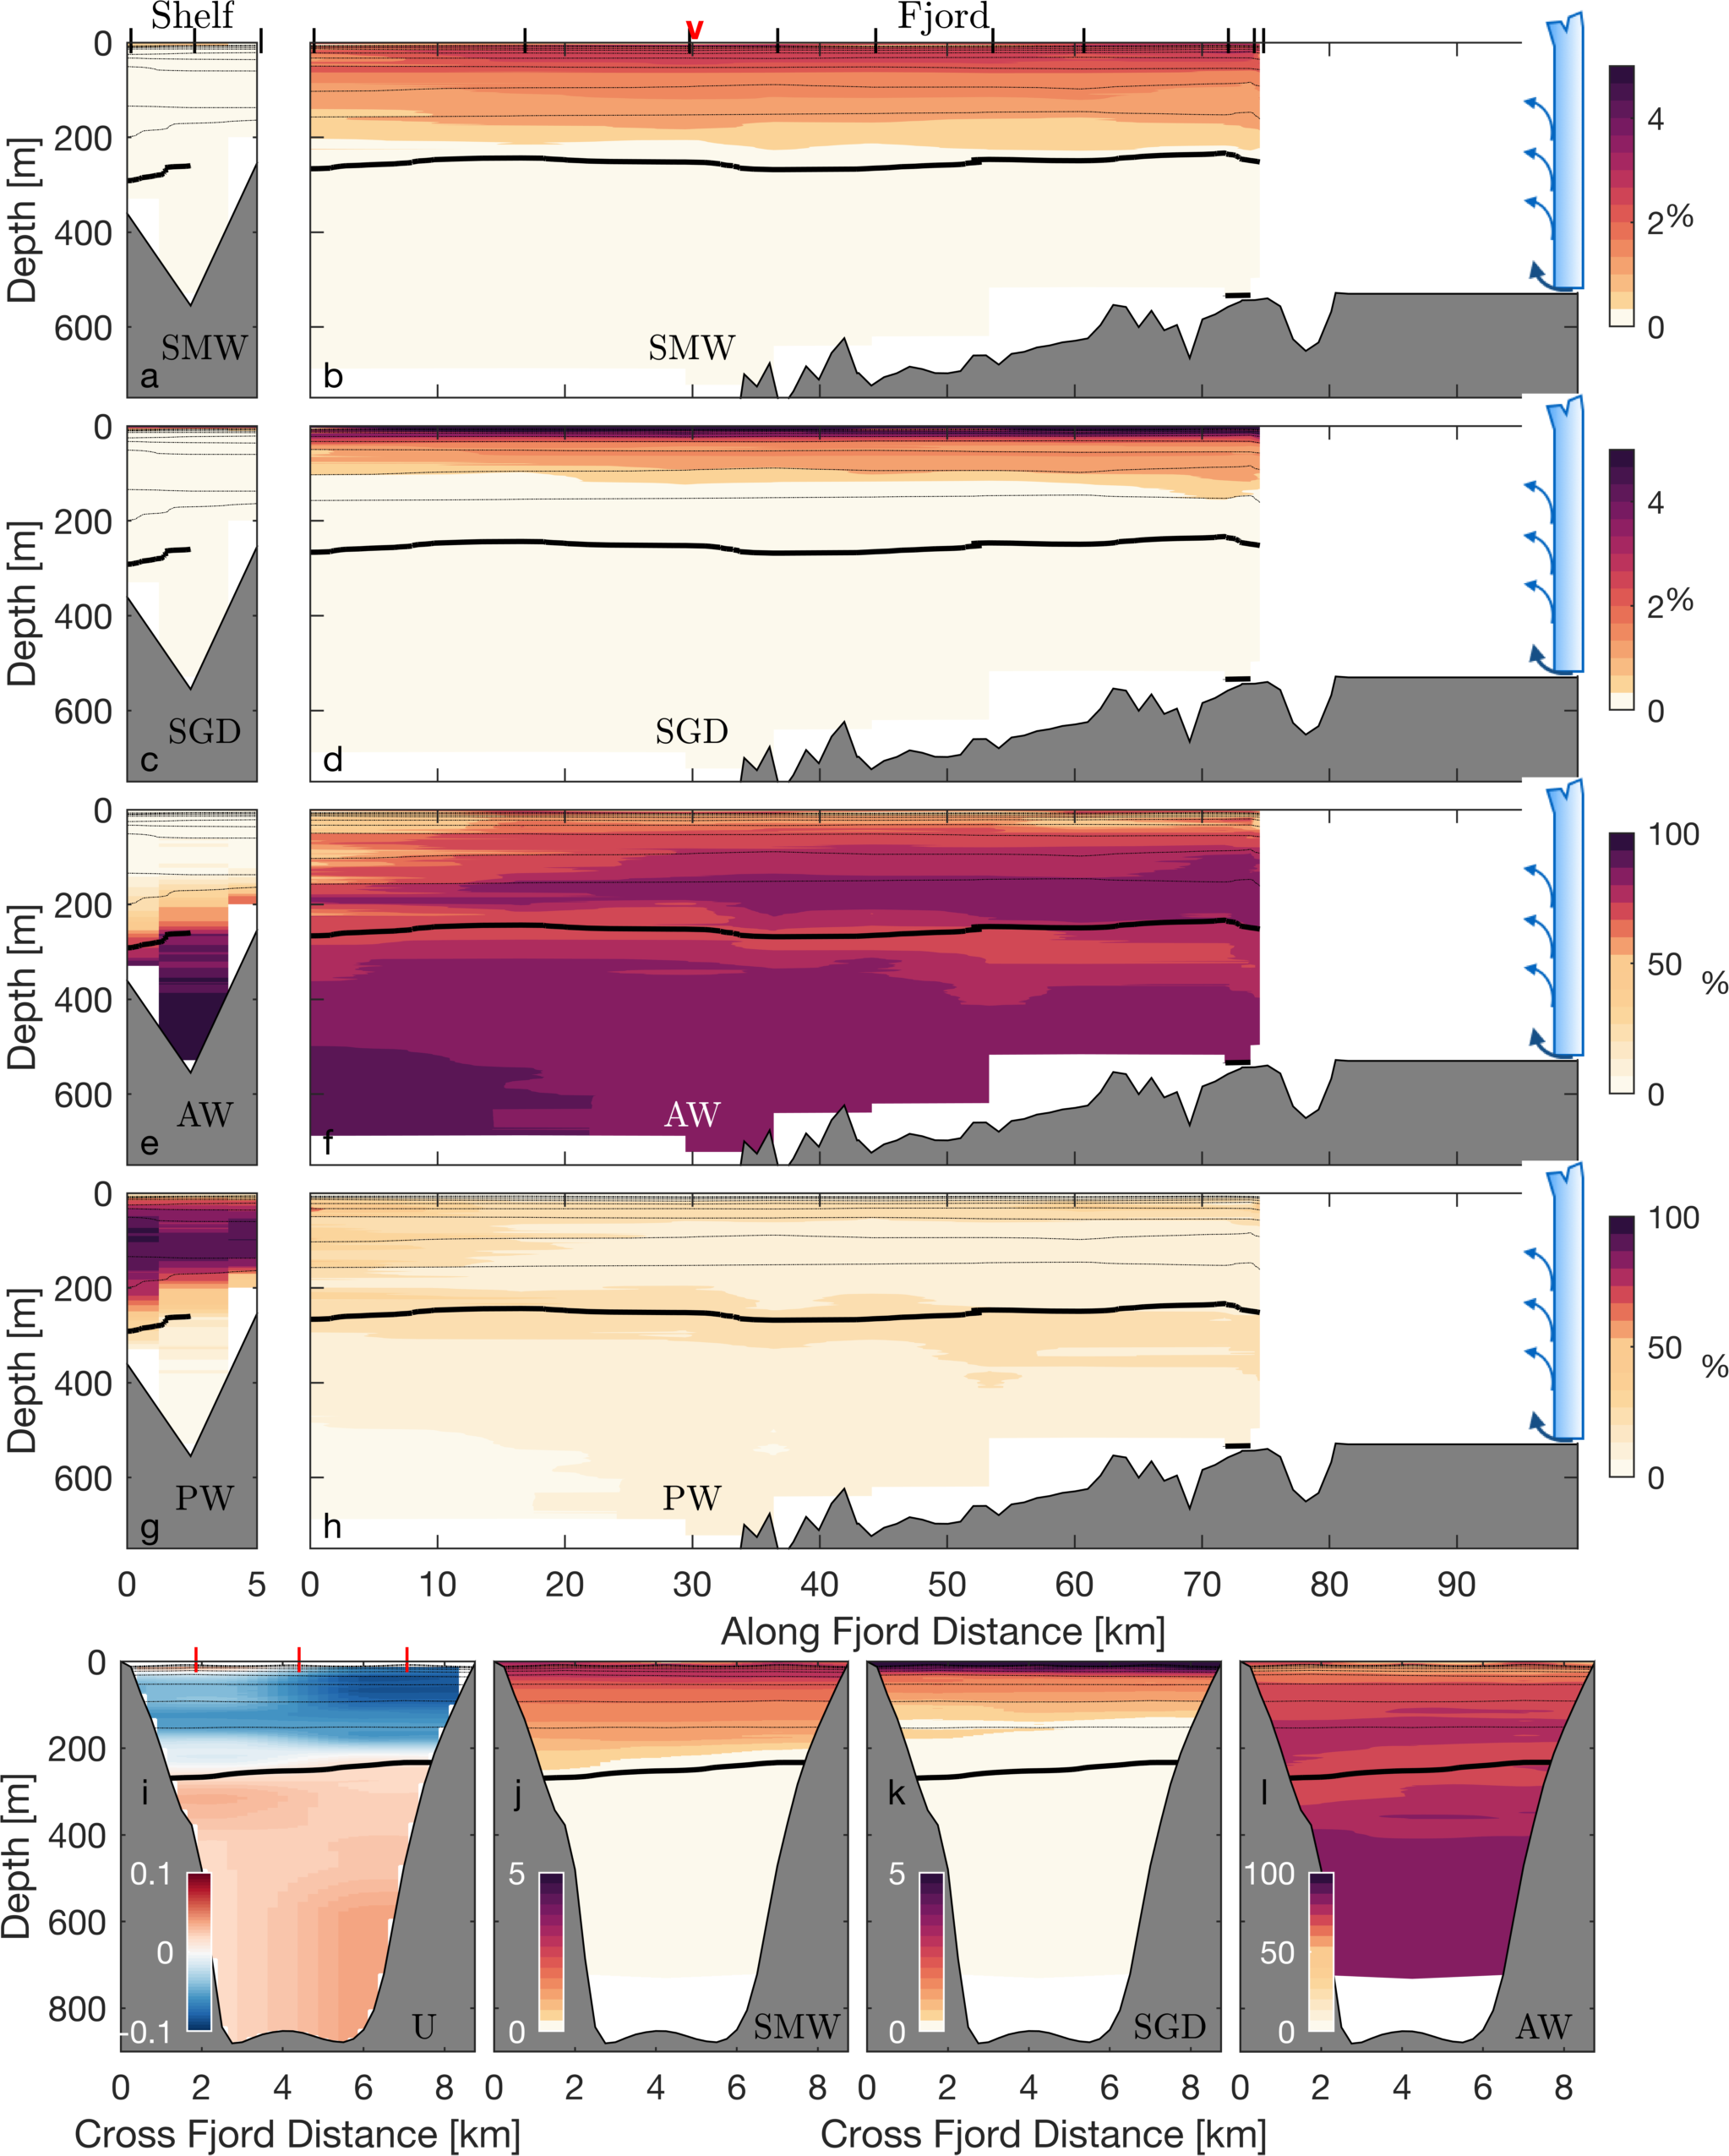
The Greenland Ice Sheet has been melting at an accelerating pace. As it melts, more and more freshwater drains into the Northern North Atlantic. This may have significant impacts on ocean circulation. In order to start to understand these impacts, we needed to gather some better observations of the spreading of ice sheet meltwater around coastal Greenland. In this work we are using noble gases that are trapped in glacial ice (like helium and neon) as a natural “dye” that traces out the pathways of ice melt in coastal waters. These “dyes” give us a powerful tool to measure the pathways and amount of melted ice pouring into the ocean (see results of the method from Helheim, Jakobshavn , and Eqip Sermia glaciers). This work quantifies the flux of two types of meltwater in a major East Greenland fjord and shows that the meltwater is highly diluted by mixing with warm, salty waters from the deepest part of the fjord. Identifying which ocean waters dilute the glacial melt is one step toward better representing these processes in numerical models.
Subduction at the Polar Front
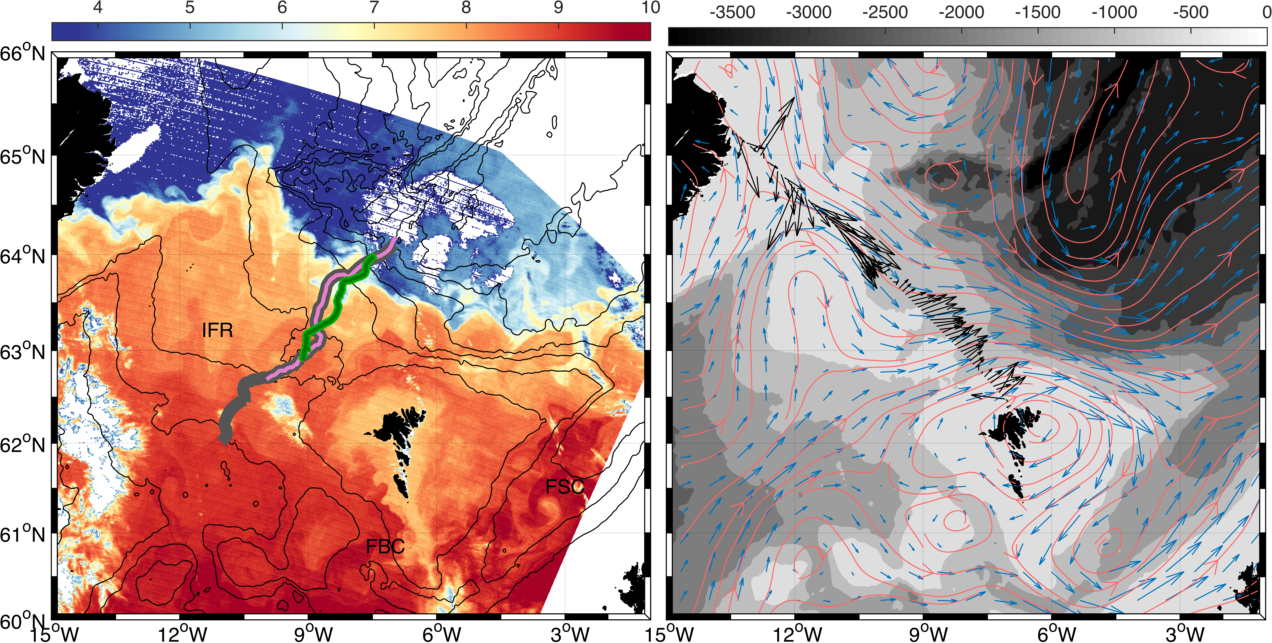
The polar front in the North Atlantic is bound to the ridge between Iceland and the Faroe Islands, where about one-half of the northward transport of warm Atlantic Water into the Nordic Seas occurs, as well as about one sixth of the equatorward dense overflow. We use a comprehensive glider survey to investigate instability and subduction at the front and its relationship with wintertime mixing.
Vertical Velocity & gliders
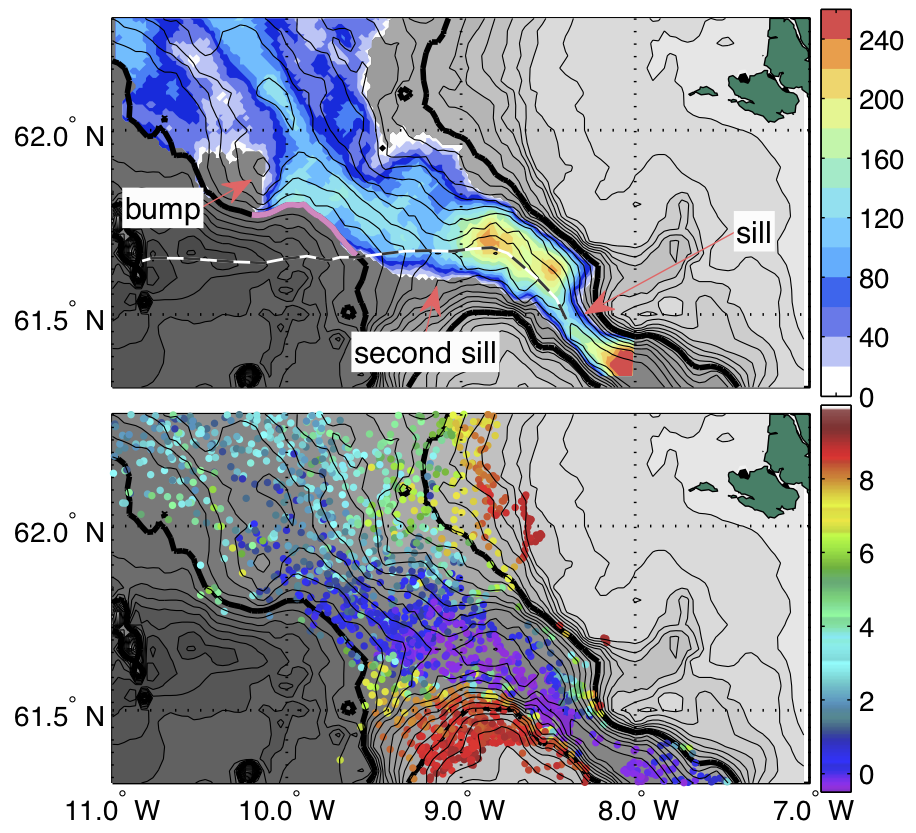
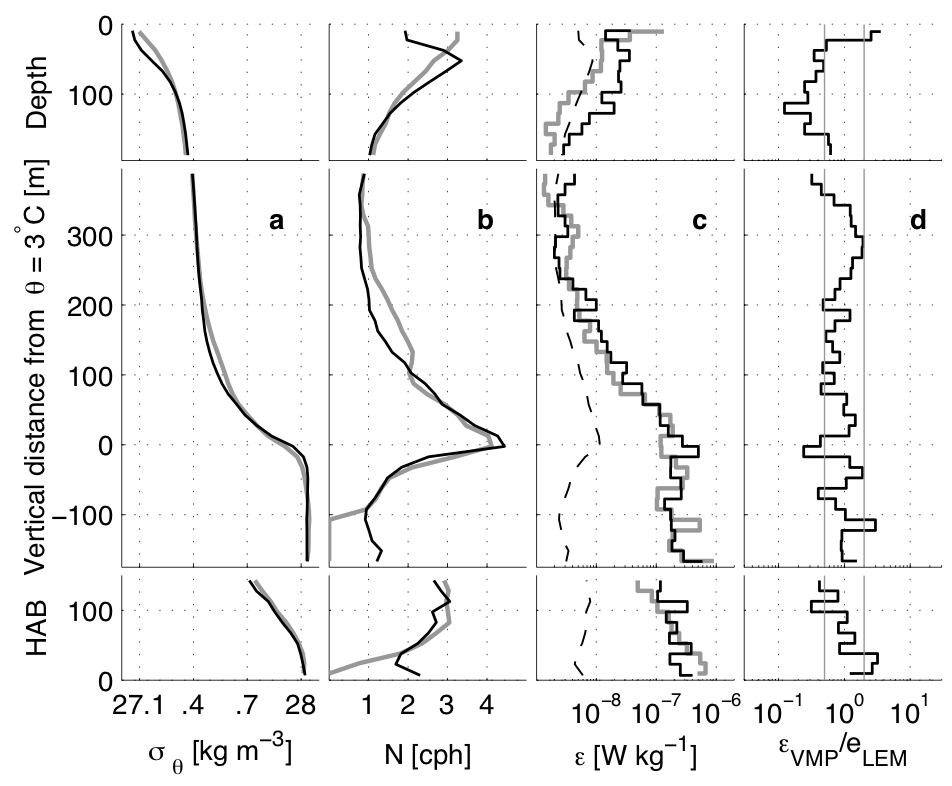
Turbulent mixing is an important process controlling the descent rate, water mass modification and volume transport increase due to entrainment in the dense overflows across the Greenland-Scotland Ridge. These overflows, along with entrained Atlantic waters, form a major portion of the North Atlantic Deep Water which pervades the abyssal ocean. Three years of Seaglider observations of the overflows across the eastern Greenland-Scotland Ridge are leveraged to map the distribution of dissipation of turbulent kinetic energy on the Iceland-Faroe Ridge. A method has been applied using the finescale vertical velocity and density measurements from the glider to infer dissipation. The method, termed the Large-Eddy Method (LEM), is compared with a microstructure survey of the Faroe Bank Channel (FBC). The LEM reproduces the patterns of dissipation observed in the microstructure survey, which vary over several orders of magnitude. Agreement between the inferred LEM and more direct microstructure measurements is within a factor of two. Application to the 9432 dives which encountered overflow waters on the Iceland-Faroe Ridge reveals three regions of enhanced dissipation: one downstream of the primary FBC sill, another downstream of the secondary FBC sill, and a final region in a narrow jet of overflow along the Iceland shelf break.
Nordic Seas Overflows
Seaglider based observations of Faroe Bank Channel structure, and Iceland Faroe Ridge overflow transport , and observations of seasonal subduction across the polar front boundary between the Iceland Basin and Nordic Seas.